Integrated Reasoning
Welcome to the new section of the GMAT! If you are a repeat test-taker, you are probably wondering what this new section is all about, so I'll start off this section with a few questions and answers to set your mind at ease.
FAQ about Integrated Reasoning
The GMAT has changed?
Yes, but have no fear. You won't suddenly see sine waves and matrices on the Quantitative Section or analogies and foreign languages on the Verbal Section! The only change is the addition of the Integrated Reasoning section, a 30-minute section that comes after the Analytical Writing Assessment. In fact, the Integrated Reasoning section has taken the place of one of the essays, which means that the total length of the test remains the same.
Why was this change made?
The Integrated Reasoning section gives business schools another way to differentiate well-qualified applicants. The change is intended to measure your ability to analyze, evaluate, organize, and synthesize information from a variety of different source formats and then apply that information to problems that reflect the type of coursework typical for a business school student. Or maybe the change was made just because some people out there really enjoy writing test questions…
Is this new Integrated Reasoning section computer adaptive?
No.
What's this about a calculator?
The rumor is true! The Integrated Reasoning section has a basic calculator that you can access by clicking a button at the top left of the screen. This addition was made to make clear that the purpose of this section is not to test your ability to do simple calculations by hand. But remember, the calculator only understands what you tell it, so it is not a substitute for careful analysis of the information. The calculator is very basic, containing the 4 fundamental math operators (+, -, /, *) as well as the square root (√), percent (%), and reciprocal (1/x) functions.
Most of these you are probably familiar with and use quite frequently, but you may be wondering what the reciprocal function is. If you press this key after you enter a number, the result will be 1 divided by your number. For example, if you first press "9" and then "1/x," the result will be .11111. This function is useful for converting fractions into decimals and for calculating the value of a number raised to a negative exponent.
How does this change affect scoring?
The Integrated Reasoning section is not factored into the overall 800 score. The Quantitative and Verbal sections are still each given a score on the 0–60 scale and then mixed together with the secret GMAT algorithm to produce your total out of 800. Your Integrated Reasoning results are calculated by an equally mysterious algorithm to produce a score on a scale of 1–8, in single digit intervals. The percentile scale will be different from that of your main 800 score. The Integrated Reasoning percentiles are expected to be standardized by 2013.
How will I find out my Integrated Reasoning score?
Like the Essay score, the Integrated Reasoning score will not be immediately available when you complete the test. You will receive this score when your official score report arrives in the mail within 20 days of taking your test.
Do business schools care about my Integrated Reasoning score?
Well, the developers of the GMAT certainly hope so and they have conducted plenty of research among management faculty to support the inclusion of this section. Even so, exactly how much the admissions committees in the particular schools you are applying to care about this score is difficult to say. But with all the effort you are putting in to doing well on this test, why not do well on every section? The Integrated Reasoning score will be on your official report and gives you just one more chance to show what a rock star you are.
OK, great – so what exactly will I have to do on this new section?
The Integrated Reasoning section attempts to measure your skills related to the use of both quantitative and verbal information. The information in the questions is provided through text, tables, graphs, flowcharts, budgets, spreadsheets, and more. Some questions contain only one source of information and some contain multiple. And even though the test claims to only have 12 questions on the Integrated Reasoning section, many questions contain multiple parts, which means you really have to answer closer to 20 questions. The topics range from business applications to sociological studies to scientific research, and they may combine verbal and quantitative information within a single question. Although there may be subject matter with which you are unfamiliar, no external knowledge is needed to answer the questions. All questions can be answered with the information provided. Among the tasks you will have to complete are:
• Drawing conclusions, predicting trends, and making inferences
• Evaluating information for accuracy, consistency, and sufficient supporting evidence
• Calculating probabilities, rates, and basic statistics
• Identifying relationships and correlations among various sources of information
• Making strategic judgments and decisions about potential courses of action
Let's take a closer look…
Question Type 1: Graphics Interpretation
How is the information presented? You are most likely to see a scatter plot, line graph, bar graph or flow chart. You could also see some other visual representations of information, such as a Venn diagram (two or more interlocking circles used to show overlap among members of various groups) or a pie chart.
What is the format of the questions? Each visual is followed by 2 questions that have answers pre-populated in a drop-down menu. The number of options in the drop-down menus varies.
What concepts are tested? Frequently seen question types are about probability, slope, direct and indirect variation, averages, and percent change. Some questions also simply test your ability to interpret the graph or table correctly.
Example #1
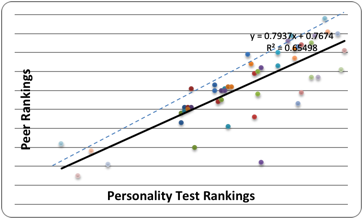
The graph above is a scatter plot with 50 points. Each point represents a score that measures how well a first year MBA student works in a group. A score of 1 indicates that a student does not work well in a group and a score of 10 indicates that a student works very well in a group. To obtain these scores, the students were administered a personality test at the beginning of the semester and then ranked by their peers at the end of the semester. The solid line is the regression line and the dashed line is the line through points (0,0) and (10,10).
Use the drop-down menus to fill in the blanks for each of the following statements based on the information given in the graph.
The slope of the regression line is
 the slope of the dashed line.
The scatter plot demonstrates that the personality test
ranked most students ability to work in groups
 their peers did.
Answer & Explanation
The slope of the regression line is less than the slope of the dashed line.
Remember that the slope formula is:
![]()
Coordinates are given to you for the dashed line, so you can put those into the formula to see that the slope of the dashed line is 1. The change in y is the rise on the graph and the change in x is the run. Because the regression line is rising more slowly than the dashed line, its slope is less.
The scatter plot demonstrates that the personality test ranked most students ability to work in groups higher than their peers did.
The dashed line with the slope of 1 is the line along which all points would lie if the personality test and the peer rankings yielded the same results. However, the majority of the points lie beneath that line. This means that the peer rankings were lower than what was expected, so the personality test rankings were higher. Another option is to select several points on the graph and look at their coordinates. By comparing the actual x values (personality test) with the y values (peer rankings), you can tell the x values are most often higher.
Example #2
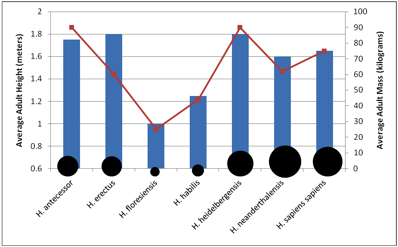
The graph above gives key developmental data, gathered from fossil records, about several species within the Homo genus. The bars indicate the average height (in meters) of an adult in the species, the points on the line indicate the average mass (in kilograms) of an adult in the species, and the bubbles offer a relative comparison of average adult cranial capacity (in cubic centimeters). H. sapiens sapiens is the only species still in existence.
The correlation between average cranial capacity and average
adult mass for the species shown in the graph

The probability of a species having both a greater average adult height and greater average adult mass than does H. sapiens sapiens is

Answer & Explanation
The correlation between average cranial capacity and average adult mass for the species shown in the graph cannot be determined.
You should select several species and compare the values of cranial capacity and mass. For example, H. heidelbergensis and H. sapiens sapiens both have a mass greater than that of H. neanderthalensis, but a smaller cranial capacity. Conversely, H. antecessor and H. erectus have both a mass and cranial capacity greater than those of H. floresiensis and H. habilis. There is no consistent pattern, so the correlation cannot be determined.
The probability of a species having both a greater average adult height and greater average adult mass than does H. sapiens sapiens is 1/3.
Probability is calculated with the formula
![]()
In this case, there are six other species to compare to H. sapiens sapiens, so what you've got is six. Two of those fit the criteria of having both a greater average adult height and a greater average adult mass than does H. sapiens sapiens, so what you want is 2. Therefore, the answer is 2/6 , which reduces to 1/3.
Remember!
• Even if the graphic seems simple, take time to read all the information given before you begin. This includes the text, which can offer information that will make the graphic easier to understand.
• Pay attention to units. This means comparing the units given in the chart or graph to the units in the question. If they are not the same, make a note on your scratch paper to remind yourself to convert the quantities. This also means knowing the numerical value of a symbol in a chart or a graph. A chart may contain a symbol that stands for a value in the hundreds or thousands. You may need to consider that actual value when calculating your answer.
• If a graph has two vertical axes, make a note of which lines or bars correspond to which axes. This information will be included in the text if the graphic does not have a legend.
• If the graphic is a flow chart, pay attention to not only the direction of the arrows and lines, but also any conditions that are stated in order to move from one step to the next. Flow charts may contain repeated loops if certain criteria are not met, so be sure to trace the path carefully. A rectangle indicates an action and a diamond indicates a decision.
• Use the answer choices in the drop-down menu to help yourself understand the question better. You may be able to answer the question many ways just based on the graphic, but the answer choices will make the question more specific.
Question Type 2: Two-Part Analysis
How is the information presented? These questions usually contain a lot of text in paragraph form but can also include supplemental information, such as formulas or bulleted lists.
What is the format of the questions? Each problem contains two questions given in a table with three columns. The first two columns each contain a question and the final column contains the answer choices to select from. You will select one answer choice for each question. The answer choices may be numbers, formulas, or text and the number of answer choices available will vary. The two questions may or may not be dependent on each other. If the questions are not mutually exclusive, there may be one answer choice that is correct for both questions.
What concepts are tested? Frequently seen question types are about direct and indirect variation, percent change, rate formula, and logical inference.
Example #1
The manufacturing facilities of Factory ABC operate 50 hours per week over a span of 5 days. Under normal operating conditions, Factory ABC can produce x widgets per hour. These widgets are sold wholesale for $8.00 each. The cost of production of the widgets is y dollars per widget, plus a fixed cost of z dollars per business day. The CEO of Factory ABC is considering implementing lean manufacturing measures to lower the cost of production. These measures will not change the cost or selling price per widget, but the CEO estimates that they will reduce the fixed costs by 20 percent.
In terms of the variables x, y, and z, select the expression that represents Factory ABC's profit if it sells all the widgets, without a discount, that it manufactures in one week under normal operating conditions. Then, select the expression that represents Factory ABC's potential profit if it implements lean manufacturing measures and then sells all the widgets, without a discount, that it manufactures in one week. Make only two selections, one in each column.
| Profit Under Normal Operating Conditions | Profit Under Lean Manufacturing Measures | Answer Choices |
|---|---|---|
| 40x− (50y + z) | ||
| ✓ | 400x– 5(10xy + z) | |
| 50(10x–xyz) | ||
| 40x − (50y + z) 1.2z | ||
| ✓ | 320x– 4(10xy +.8z) | |
| 2(200x – 25xy – 2z) |
Answer & Explanation
Profit under Normal Operating Conditions: 400x – 5(10xy + z)
This question contains a lot of variables and some very complicated formulas. Rather than running the risk of making a mistake with all those letters, a good option is to assign numbers to the variables, which will turn this algebra problem into simple arithmetic.
Let's say that the factory produces 3 widgets per hour, each widget costs 2 dollars to make, and the fixed costs are $20 per day. In other words, x = 3, y = 2, and z = 20. Profit equals revenue minus cost, so let's calculate each of those.
The revenue is the number of widgets per hour, times the total number of hours, times the wholesale price per widget. With our numbers, this is 3 × 50 × 8, or 1,200. The cost equals the number of widgets per hour, times the total number of hours, times the cost per widget. This is 3 × 50 × 2, or 300. In addition, you need the fixed cost per day times the number of days. This is 5 × 20, or 100. Therefore, revenue minus cost equals 1,200 – 400, which makes the profit 800.
When we put those numbers into the correct answer, we see that we get the same result: (400 × 3) – 5((10 × 3 × 2) + 20). 1,200 – 5(80) = 800. No other answer will yield that result with those values for x, y, and z.
Profit under Lean Manufacturing Measures: 2(200x – 25xy – 2z)
You already know that the answer to the second question cannot be the same as the answer to the first. The profit must be higher because there was a decrease in cost. So you have already eliminated one answer choice. Next, just use the same numbers you assigned in the first question to answer this one, but remember that z should be reduced by 20 percent to 16.
Let's use the equation from question one to avoid unnecessary rework, remembering to substitute 16 for 20 to get the new result. (400 × 3) – 5((10 × 3 × 2) + 16). 1,200 – 5(76) = 820. Now enter the values for the variables (z reverts back to 20) into the remaining choices to see which matches 820. In our correct answer choice, this looks like: 2((200 × 3) – (25 × 3 × 2)– (2 × 20)), or 2(600 – 150 – 40) = 820.
On a side note, if you really were not sure how to answer these questions, or you were down to your last few seconds and just had to take a guess, you could guess the correct answers just by understanding the principle that profit is revenue minus cost. Since the revenue does not change under lean manufacturing, you could select the correct answers because they are the only two with the same value for profit (400x and 2(200x)). But that's just guesswork. Be sure to solve it out if you have the time!
Example #2
The following excerpt discusses the necessary conditions for successfully growing Apium graveolens, (better known as celery!)
Apium graveolens is a finicky crop that rarely yields a reward proportionate to the effort required to grow it. The ideal combination of soil quality, climate, and weather patterns is nearly impossible to achieve in most standard home gardens. The seeds have a germination period of two weeks, during which time they must be kept at a temperature of 70°F. After germination, seedlings can be transplanted outdoors, but only if the outdoor temperature will not go lower than 55°F. The growing period for Apium graveolens is five months, but few climate zones will maintain that minimum temperature for such an extended period of time. Compounding the difficulty of finding an appropriate climate zone is that Apium graveolens will not grow well in areas that are hot and arid yet requires six hours of direct sunlight per day. The shallow root system of this plant necessitates human intervention, primarily through constant weeding and the use of mulch, to retain moisture, and the soil should have a pH of 6.0–6.5, which is to say it has a slight acidity level.
Based on the explanation above of the difficulty of growing Apium graveolens, which of the following must occur for successful growth, and which of the following must not occur for successful growth? Make only two selections, one in each column.
| Must Occur for Successful Growth | Must Not Occur for Successful Growth | Answer Choices |
|---|---|---|
| Transplanted seedlings are kept indoors to protect them from frost | ||
| ✓ | Climate control in the plant's environment for almost half year | |
| A professional farm or garden designed just for growing Apium graveolens | ||
| ✓ | Wind transportation of the seeds to a neighbor's garden without his awareness | |
| Apium graveolens reproduces asexually in the wild |
Answer & Explanation
Must Occur for Successful Growth: Climate control in the plant's environment for almost half a year is correct because germination requires 2 weeks and the subsequent growing season is 5 months. In both phases, the plant will not grow well if the temperature dips below a certain level and if adequate sun and moisture are not provided. A professional farm or garden designed just for growing Apium graveolens may be ideal, but is not necessary. The passage only states that it is nearly impossible, but not completely impossible, to grow Apium graveolens in a standard home garden.
Must Not Occur for Successful Growth: Wind transportation of the seeds to a neighbor's garden without his awareness is the correct answer because the passage emphasizes the amount of human intervention required to grow Apium graveolens in a home garden*.* Keeping transplanted seedlings indoors to protect them from frost does not necessarily prevent successful growth because it is possible to provide 6 hours of direct sunlight from an indoor location. Asexual reproduction of Apium graveolens in the wild is incorrect because the passage only discusses Apium graveolens grown in a garden. No inferences about wild Apium graveolens can be made. In addition, one might logically assume that since the parent Apium graveolens was already growing successfully in the wild, in order to reproduce there, its offspring will grow successfully as well.
Remember!
• Read the full question carefully. The headings in the columns are often just abbreviated explanations of the questions and you may misunderstand the task if you do not read all of the information.
• Decide whether the two questions are dependent on each other or influence each other in some way. If they are dependent, find the answer to the easier question first and then use that knowledge to eliminate answer choices for the second question. Often times, you can use the relationship between questions to determine which will yield a larger answer. Then you can eliminate answer choices that are too big or too small.
• If the questions are independent, remember that one answer can satisfy both questions. You can still answer the easier question first, but don't let your answer to the easier one influence your answer to the remaining question.
• If the answer choices contain equations with variables, considering assigning numbers to the variables. Working with real numbers can be easier than working with unknowns.
• If the answer choices contain numbers instead of variables, use properties of numbers and the criteria in the problem to eliminate answer choices. For example, if a problem discusses a group of MBA students who need to be split into three equally-sized groups to work on a project, you know that the total number of students must be divisible by three because you cannot have a partial student. Eliminating answers before you start calculating can help you make a good guess if you are running out of time and can help you avoid careless errors.
Question Type 3: Multi-Source Reasoning
How is the information presented? The information is presented across three separate documents, which are accessed via tabs at the top of the screen. The tabs have a brief title that describes what the documents contain. You can only see one document at a time. The documents can take a variety of formats, such as emails, budgets, standard paragraphs, or tables. When a source is primarily text, it will generally be limited to fewer than 300 words.
What is the format of the questions? Some of these questions have three statements with Yes and No options. You will have to determine whether the statement can be proven true by the information given. The three statements might also contain algebraic expressions or numerical values and you will have to determine whether those expressions or values will solve a given question. You might also see multiple-choice questions with 5 options. Unlike the other Integrated Reasoning problems, Multi-Source Reasoning can have several independent questions that appear on different screens. You have to answer each question in order to move on to the next, and you cannot move back and forth among the questions.
What concepts are tested? Frequently seen question types are about logical inference.
Example #1
Email from Marketing Director at Company Q to Project Manager at Company Q
April 8, 9:53 a.m.
As you know, the marketing proposal is due in two weeks and even though this is a relatively low budget client, winning this account is important to our company. The information you have already gathered on the client's history, market positioning, and target audience is substantial and well researched. I have also put together a few documents that will help you write the proposal. Attached is the budget that we have created for this project. Also attached is a fact sheet on our competitors who will also be submitting tenders for this job. This sheet will help you compose our value proposition in a way that shows the client how we are unique to ensure the success of our bid. Please review the documents and contact me as soon as possible with any questions you may have.
Budget
| Item | Cost |
|---|---|
| Contractors | $75,000 |
| Materials | $250,000 |
| Internal Resources | $45,000 |
| Media | $200,000 |
| Contingency Fund | $50,000 |
| Total | $620,000 |
Competition
Company X: This company is the most widely known in the field of marketing. Many of its proposals are accepted simply because of the company's name. However, surveys published in trade journals reveal that clients of this company often do not feel that they received value commensurate with the price the company charges.
Company Y: This company is the cost leader in the marketing industry. It outsources much of its design work to foreign partners, which allows it to undercut its competitors. However, the company has made several, well-publicized errors in its recent work, which have really damaged its reputation. Still, clients who have a low marketing budget are more likely to use this company in order to keep expenses low.
Company Z: This company, which is new to the field, is already earning a good reputation for itself in the field as a highly innovative, cutting-edge marketing company. In addition, the CEO has many powerful connections and is well-liked. However, because of its dedication to innovation, the company tends to be inflexible. The employees view themselves as artists and are very protective of their work. They prefer to create a product that pleases themselves, rather than the client.
Which of the following statements about the company's market proposal is best supported by the information in the three documents?
A. Company Q could lower some of its Contractor and Internal Resources costs if it outsourced work to foreign partners.
B. Company Q's proposal is likely to win because its competitors have serious flaws that the client will not ignore.
C. Company Q's is damaging its chances of winning because its budget is too high.
D. Company Q's proposal should focus on factors other than reputation, cost, and innovation in order to win.
E. Company Q's Project Manager was lacking important information about the client before receiving the email.
Answer & Explanation
Company Q's proposal should focus on factors other than reputation, cost, and innovation in order to win.
The first answer choice is not supported because the documents offer no information about who Company Q's contractors are currently. Maybe Company Q is already using foreign partners. The documents also offer no information about the wages Company Q pays its contractors, if in fact they are domestic, in comparison to wages for foreign partners.
The second answer choice is not supported because the documents offer no information about the desires and priorities of the client. It is possible that some of the flaws in the competition will not present a problem for the client.
The third answer choice is not supported because although the email indicates that the client has a low budget, no figures are offered. Company Q plans to charge $620,000 for the project, but none of the documents indicate whether this is a high or low figure for the client.
The fifth answer choice is not supported because the Project Manager received information from Marketing Director about the budget and the competition, not about the client.
So why is the fourth answer choice correct? The Marketing Director's email says that the project manager should incorporate the information from the competitor fact sheet in order to compose our value proposition in a way that shows the client how we are unique to ensure the success of our bid. Reputation, cost, and innovation are all ways in which the competitors differentiate themselves. Emphasis on those factors would not make Company Q look unique.
Example #2
Etymology
The modern American English lexicon is an amalgamation of many other languages, though the primary roots are West Germanic. American colonists borrowed many words from the Native Americans to describe the variety of plants, animals, and natural phenomena that were unknown in England at the time. The language of the nation of immigrants was also naturally populated by loanwords from foreign tongues as the nation expanded. And over time, societal changes, such as the American and Industrial Revolutions, generated a host of neologisms to describe new inventions and unprecedented cultural events.
But these words have not been static. They have morphed through the generations, claiming new meanings that may seem only distantly related to their origins and finding new life by transforming from nouns into verbs, or adjectives into nouns. They have joined with their comrades to create an army of compound words, in that great Germanic tradition. Some have even altered themselves so drastically as to move from a positive to a negative connotation.
Perhaps no word exemplifies the transitory nature of proper word usage in America as much as "OK" does. The origins of this word, which now has international renown, are imprecise, though one well-known explanation is that it was an abbreviation for oll korrekt, a comical misspelling of all correct that was popular in the 1830s in America. Regardless of the origin, the journey of this little word across the American lexicon has been nothing less than astounding. What other word has a rightful place in so many parts of speech and can betray its own significance in a single breath by denoting both an encouraging and a critical tone.
Parts of Speech
The following table identifies the ways in which the word "OK" is used in modern American English.
| Part of Speech | Connotation |
|---|---|
| Adjective | positive |
| Adjective | mediocre |
| Adverb | positive |
| Adverb | mediocre |
| Exclamation | disbelief |
| Exclamation | frustration |
| Function Word | agreement |
| Noun | approval |
| Stand-alone Question | comprehension |
| Verb | approval |
Hypotheses
The following table identifies some of the hypothesized origins of the word "OK."
| Spelling | Year | Source |
|---|---|---|
| kay | 1784 | travelogue written by a European visiting America |
| okeh | 1825 | translations of the Bible written by domestic American missionaries who were working with the Choctaw Indians |
| Oll Korrect or O.K. | 1839 | newspapers in Boston and New York |
| OK | 1840 | an abbreviation for presidential candidate Martin Van Buren's nickname, Old Kinderhook |
| ola kala | 1942 | scholarly article on the possible origins of the word from a Greek phrase meaning "all good" |
| och aye | 1964 | scholarly article on the possible origins of the word from a Scottish phrase meaning "oh yes" |
| o ke | 1969 | scholarly article on the possible origins of the word from a West African phrase meaning "yes, indeed" |
For each of the following statements, select Yes if the statement can be inferred based on the information provided. Otherwise, select No.
| Yes | No | Statement |
|---|---|---|
| ✓ | Considering the numerous parts of speech that the word "OK" has adopted and the fact that it can be positive or negative, it is unusual that "OK" is not also found in a compound word. | |
| ✓ | The modern word "OK" is known to be derived from a word that existed in print prior to the appearance of "O.K." in a Boston newspaper. | |
| ✓ | The linguistic influence of immigrants on American English and a predominance of hypotheses that indicate OK has origins in a foreign language discredit the idea that OK is an abbreviation for oll korrekt. |
Answers & Explanation
Considering the numerous parts of speech that the word "OK" has adopted and the fact that it can be positive or negative, it is unusual that "OK" is not also found in a compound word. No
This answer choice is not supported because of the word unusual. The "Etymology" document indicates that adopting new parts of speech, changing tone, and becoming parts of compound words are all ways in which words in the modern American English lexicon have changed. What the document doesn't indicate is that a word that changes in one of those ways necessarily changes in the other two as well. There is no reason given to support the idea that "OK" should appear in compound words merely because it changed in two other ways.
The modern word "OK" is known to be derived from a word that existed in print prior to the appearance of O.K. in a Boston newspaper. No
This answer choice is not supported because all of the possible origins given for "OK" are just hypotheses. The printed appearances of kay and okeh, in 1784 and 1825 respectively, may not be related to the modern "OK." The "Etymology" documents explicitly states that the origins of "OK"are imprecise. Therefore, this answer choice is too definitive to be supported by the documents.
The linguistic influence of immigrants on American English and a predominance of hypotheses that indicate OK has origins in a native language discredit the idea that OK is an abbreviation for oll korrekt. No
This answer choice is not supported because the of the word discredit. The documents offer no comparison or reason to believe any one hypothesis is superior to another. The "Etymology" document says that the oll korrekt hypothesis is well-known, but does not make any judgments regarding its credibility or lack thereof.
Remember!
• Read through all the sources before you begin. Don't read for a lot of detail, but try to get a general understanding of the main idea.
• Make notes on how the different sources relate to each other. Some possible relationships include:
-
A series of correspondences. In this case, take notes on who is communicating with whom in each case. Make sure that you don't confuse one person with another.
-
A general theory or set of conditions or rules, and then a specific example of that information in action. Make sure that you understand whether the specific example has followed all criteria laid out in the general tab.
-
Data presented over different periods of time. Make sure you know the time frame and the units of measure for all data presented.
• After you read the first question, go back to the sources to read for more detail. All information needed to answer the question will come directly from the sources, but the correct answer choice could be written in a confusing way. Take the time to find evidence for the correct answer choice instead of trying to answer a question from memory.
• Think carefully about which source can answer a particular question. Sometimes, one source may seem to be obvious, but you may have overlooked relevant information a second or third source.
• If a source contains numerical data, take time to do the calculations required by a question.
Question Type 4: Table Analysis
How is the information presented? The information is given in a spreadsheet that can be sorted by selecting the column you want to sort by from a drop-down menu above the spreadsheet. The number of rows and columns in each spreadsheet varies. The spreadsheet may also be accompanied by text that explains what the table is about or gives additional information.
What is the format of the questions? Each table is followed by three statements with two mutually exclusive options (for example, Yes and No). For some statements, you will have to determine whether the statement can be proven true by the information given or whether the statement is consistent with the information given. For others, you will have to decide whether the table even gives enough information to support the statement.
What concepts are tested? Frequently seen question types are about percent change, direct and indirect variation, median, average, and comparative rankings.
Example #1
Sort By:
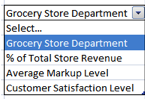
Information on the Departments in Discount Grocery Store X
| Grocery Store Department | % of Total Store Revenue | Average Markup Level | Customer Satisfaction Level |
|---|---|---|---|
| Bakery | 7 | High | Very |
| Dairy | 11 | Low | Very |
| Deli | 4 | High | Very |
| Dry Goods | 21 | Low | Very |
| Frozen Food | 14 | Low | Somewhat |
| Household Products | 10 | Moderate | Somewhat |
| Meat and Seafood | 14 | Low | Very |
| Pharmacy | 7 | Moderate | Not at All |
| Produce | 12 | Low | Somewhat |
For each of the following statements, select Yes if it can be inferred from the information in the table. Otherwise, select No.
| Yes | No | Statement |
|---|---|---|
| ✓ | Grocery Store X most likely sells a greater quantity of Dry Goods than Bakery items. | |
| ✓ | The level of customer satisfaction has a direct relationship to the revenue earned by a department. | |
| ✓ | Compared to other discount grocery stores, Grocery Store X offers customers a good value on non-food items. |
Answer & Explanation
Grocery Store X most likely sells a greater quantity of Dry Goods than Bakery items. Yes
Sort the table by "% of Total Store Revenue." This sort order makes it easy to see that Dry Goods bring in much more revenue than Bakery does, but the Average Markup Level on Bakery items is higher. If Grocery Store X has a much higher markup on Bakery items, yet earns almost its lowest percentage of revenue from the Bakery, while Dry Goods bring in 3 times the revenue, the store must be selling a greater quantity of Dry Goods.
Note that the answer choice uses the words "most likely." Although there may be some other remotely possible explanation, this one is the most likely because the chart title states that Grocery Store X is a discount store, and therefore unlikely to have any high priced, gourmet Dry Foods that would influence the revenue.
The level of customer satisfaction has a direct relationship to the revenue earned by a department. No
Sort the table by "Customer Satisfaction Level." This sort order makes it easy to see that % of Total Store Revenue varies widely within any given Customer Satisfaction level.
Compared to other discount grocery stores, Grocery Store X offers customers a good value on non-food items. No
There is no need to sort the table to see that this answer choice is not supported. Although non-food items, Pharmacy and Household Products, are described as having a moderate markup, the table does not explain what moderate means. Moderate could in fact be relative to other stores' markups, but it could just be relative to the other items in Grocery Store X.
Example #2
Sort By:
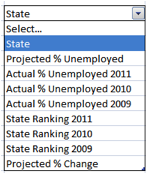
Each column of the table can be sorted in ascending order by clicking on the word "Select" above the table and choosing, from the drop-down menu, the heading of the column on which you want the table to be sorted.
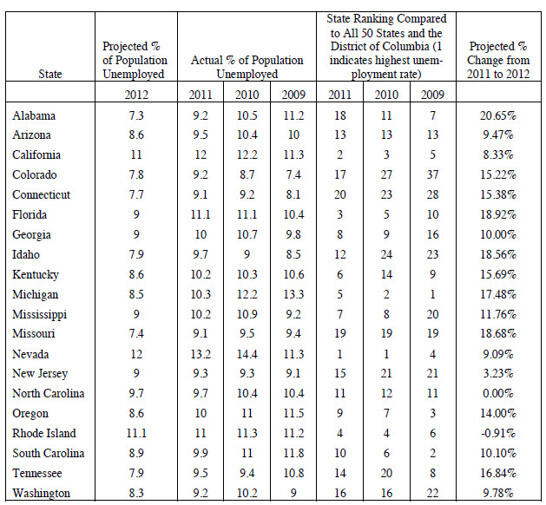
The table above gives information about seasonally adjusted unemployment rates in 20 states across a three year period. Seasonally adjusted rates take into account the normal fluctuations in unemployment caused by holidays, summer vacations, and weather patterns. The table also gives predictions for seasonally adjusted unemployment rates in 2012. The average percentage of unemployed people in the whole United States across the same period was 8.8% in 2011, 9.6% in 2010, and 9.3% in 2009. Those percentages are also seasonally adjusted.
Consider each of the following statements about the unemployment statistics of the 20 states in the table. For each statement, indicate whether the statement is true or false, based on the information provided in the table.
| True | False | Statement |
|---|---|---|
| ✓ | The average percent of population unemployed for all states within the top ten ranked in 2010 was greater than the average percent of population unemployed for all states within the top ten ranked in 2009. | |
| ✓ | The state with the greatest projected percent change in population unemployed from 2011 to 2012 also had a higher percentage of population unemployed in both 2010 and 2009 than did at least half the other states shown. |
Answers & Explanation
The average percent of population unemployed for all states within the top ten ranked in 2010 was greater than the average percent of population unemployed for all states within the top ten ranked in 2009. True
Sort the table first by State Ranking in 2010 and then by State Ranking in 2009. Then, use the calculator to obtain the average percent of population unemployed from the Actual % of Population Unemployed column for each year. The trick to this question is that in 2010, only 9 states listed in the table were in the top ten ranked. Alabama was number 11, so it shouldn't be included. In 2010, the average was 11.64 and in 2009, the average was 11.34, so the statement is true.
The state with the greatest projected percent change in population unemployed from 2011 to 2012 also had a higher percentage of population unemployed in both 2010 and 2009 than did at least half the other states shown. True
Sort the table first by Projected % Change from 2011 to 2012 to see that Alabama has the greatest projected percent change. Then, sort the table by Actual % of Population Unemployed in 2010 and 2009 to see where Alabama ranks in comparison to the other states shown, not in the rankings of all 50 states and D.C. In 2010, Alabama had the 10th highest % of population unemployed out of the 20 states shown and in 2009, Alabama had the 6th highest. Therefore, this statement is supported.
Remember!
• Read all the information given before you begin. This includes the text, which can offer information that will make the table easier to understand.
• Compare the units given in the table to the units in the question. If they are not the same, make a note on your scratch paper to remind yourself to convert the quantities. Also, if a table contains a combination of percents and values, you need to be careful not to mix them up. The percent sign is likely to be only in the table headers, not in the data itself.
• The answer choice labels are important. True/False and Yes/No labels require a definitive answer, whereas Would Likely/Would Likely Not labels are more flexible. If you have the second type, don't panic if you don't have an exact answer match. You will have to trust your estimation abilities.
• Take advantage of the ability to sort the table. Figure out what the subject of each statement is and then sort by that column in order to better see relationships among the variables. Questions that ask about variation, correlation, and ranking can often be answered simply by looking at properly sorted data.
• If the relationship among variables is not readily apparent by sight, take the time to write out the necessary equations and do the math. Questions that ask about averages, median, and percent change often require you to do the calculations.
Integrated Reasoning Strategy Recap
-
Use the calculator wisely. Graphs and charts are powerful visuals that you can use for estimation and logical inferences. Don't be tempted to waste time calculating what you can learn from sight. If you do use the calculator, remember that nerves and time pressure can make you enter numbers incorrectly without realizing you are doing so. Since the calculator saves you a lot of time, you can avoid simple errors by doing the calculations twice.
-
Read carefully and re-read the question before you confirm your answer. You might find yourself getting so caught up in the calculations that you lose track of the actual question. You can spend 2 minutes solving for x, select the answer choice that matches, and then get the question wrong because it was really asking for the square root of x, not just x. Taking a few seconds to double check the task can save you a point or two.
-
Remember that some questions only ask for the answer that is most supported, best supported, closest to, or nearest. It can be unnerving to do a bunch of calculations and then find that the answer you came up with is not among the choices. But some questions are not asking for an exact answer. If the question is verbal, it can be easy to get hung up on two answer choices that both seem correct. In that case, pick the one that is more closely related to the main idea of the text.
-
Check measurements and labels carefully. A classic GMAT trap is to offer information in one measurement (minutes, for example) and ask a question about a different one (hours, for example). Taking the time to check labels can help you avoid making a careless error on a question you would otherwise have answered correctly.
-
Don't skip over text that accompanies tables and graphs. There is always a reason that the text is there. The text might offer important information about the data in the graphs or it may explain certain assumptions that were made. If you think that there isn't enough information to answer a particular question, you may want to check the text more carefully.
-
Review all of the answer choices and use them for guidance. When the answers are numerical values, you may be able to use them to ballpark. When the answers are equations, they may give you an idea how to start interpreting the math. And when the answers are text, they may help you better define the question and narrow down the location of the source material where the answer can be found.
-
Skip around. Even though you can't move back and forth between questions, if you have a question with multiple parts, you should answer the easiest part first. Don't allow yourself to freeze up and waste time. If you are stuck, move to the next part of the question.
-
Watch the clock. Just as with the Quantitative and Verbal sections, it is important that you finish every question.